Mark E. Riley, PMP (He/Him/His)
Mark has 20 years of management and technology consulting experience, primarily in the healthcare provider industry. He is seeking a full-time job in the DC-metro area leading healthcare data science teams using his master’s degree in data science and extensive healthcare technology management consulting career.
He has worked closely with client CIOs, CFOs, and CEOs to plan, receive board approval, and implement successful projects. He has experience leading large teams, including remotely and spread across the country. Mark’s passions are technology, data, and making healthcare more effective and affordable for everyone.
Mark has successfully lead projects involving strategic planning, technology roadmap development, software evaluation and selection, software system implementation planning, software system implementation, IT governance, program and project management, data migration, data archiving, database design and development, custom software design development, and the software development life cycle (SDLC). He is a certified Project Management Professional (PMP) from the Project Management Institute (PMI).
Professional Links


Education
University of Wisconsin - La Crosse
Master of Science - Data Science
4.0 GPA
University of Wisconsin - Madison
Bachelor of Business Administration - Information Systems Analysis & Design
Data Science Coursework
- Foundations of Data Science
- Statistical Methods
- Programming for Data Science
- Data Warehousing
- Big Data High-Performance Computing
- Communicating About Data
- Data Mining & Machine Learning
- Visualization & Unstructured Data Analysis
- Ethics of Data Science
- Prescriptive Analytics
- Data Science & Strategic Decision Making
- Capstone
Foundations of Data Science
- Defined data science and explained its role in decision making.
- Described database technologies and their strengths and weaknesses.
- Created and managed simple databases in SQL Server.
- Wrote and executed SQL statements to retrieve and manage data.
- Explained key statistical concepts that built a foundation for advanced courses in the program.
- Analyzed data to solve basic analytics problems using Excel and R.
- Explained best practices that improve the effectiveness of data science projects and mitigate risks associated with such projects.
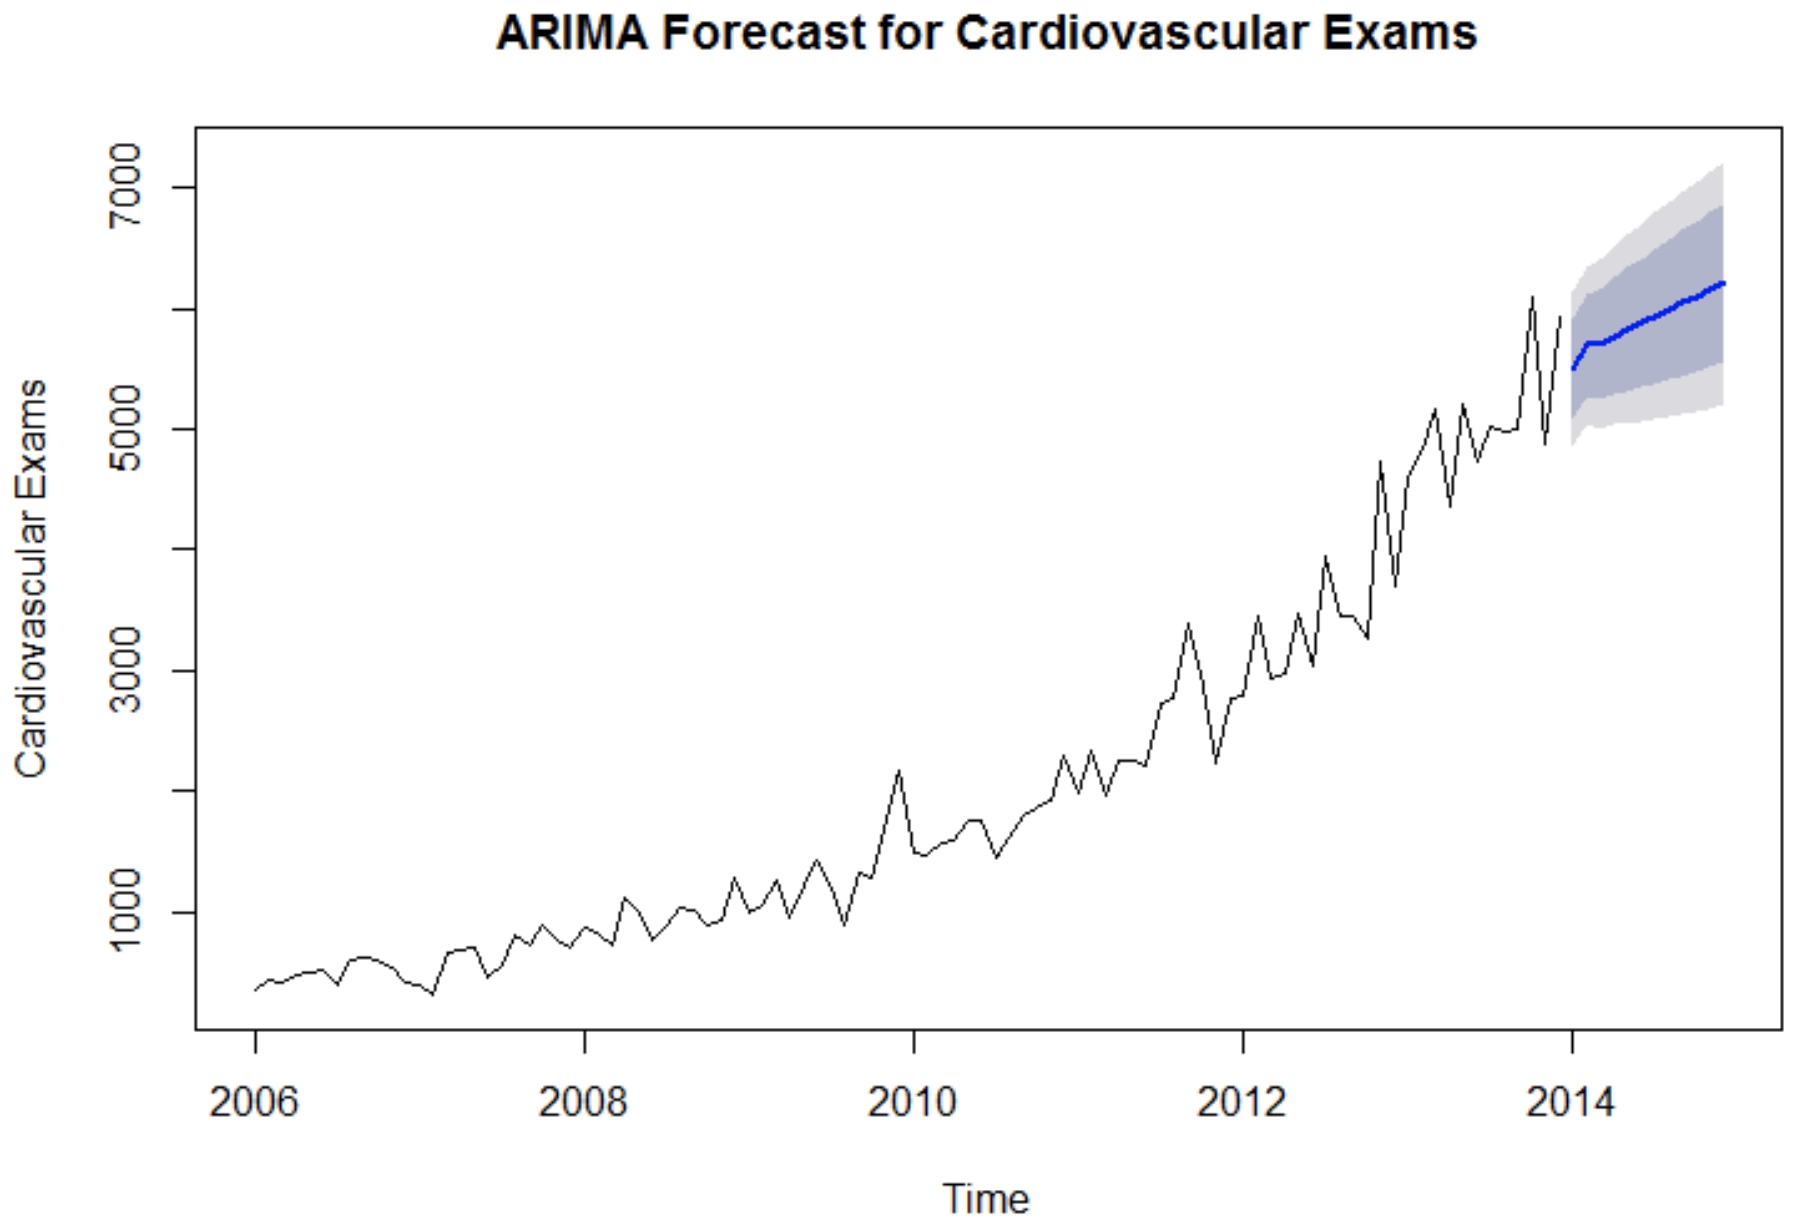
Final Project - Fargo Health Group Forecasting
My final project for this course was to apply the data science skills acquired in this class to the Harvard Business Review case study, “Fargo Health Group: Managing the Demand for Medical Examinations Using Predictive Analytics.” I cleaned the datasets, performed analysis, and generated a recommended course of action as a consultant to the Fargo Health Group.
Statistical Methods
- Examined and summarized data numerically and graphically.
- Chose the appropriate statistical procedure given a data set and a question.
- Verified conditions for statistical procedures.
- Performed hypothesis tests and computed confidence intervals.
- Explored and modeled relationships among variables and used models to make predictions.
- Used the software package R to implement statistical analyses.
- Interpreted and critically evaluated statistical information and data-based arguments.
- Effectively communicated the results of statistical analysis.
- Used R Markdown to produce statistical reports.
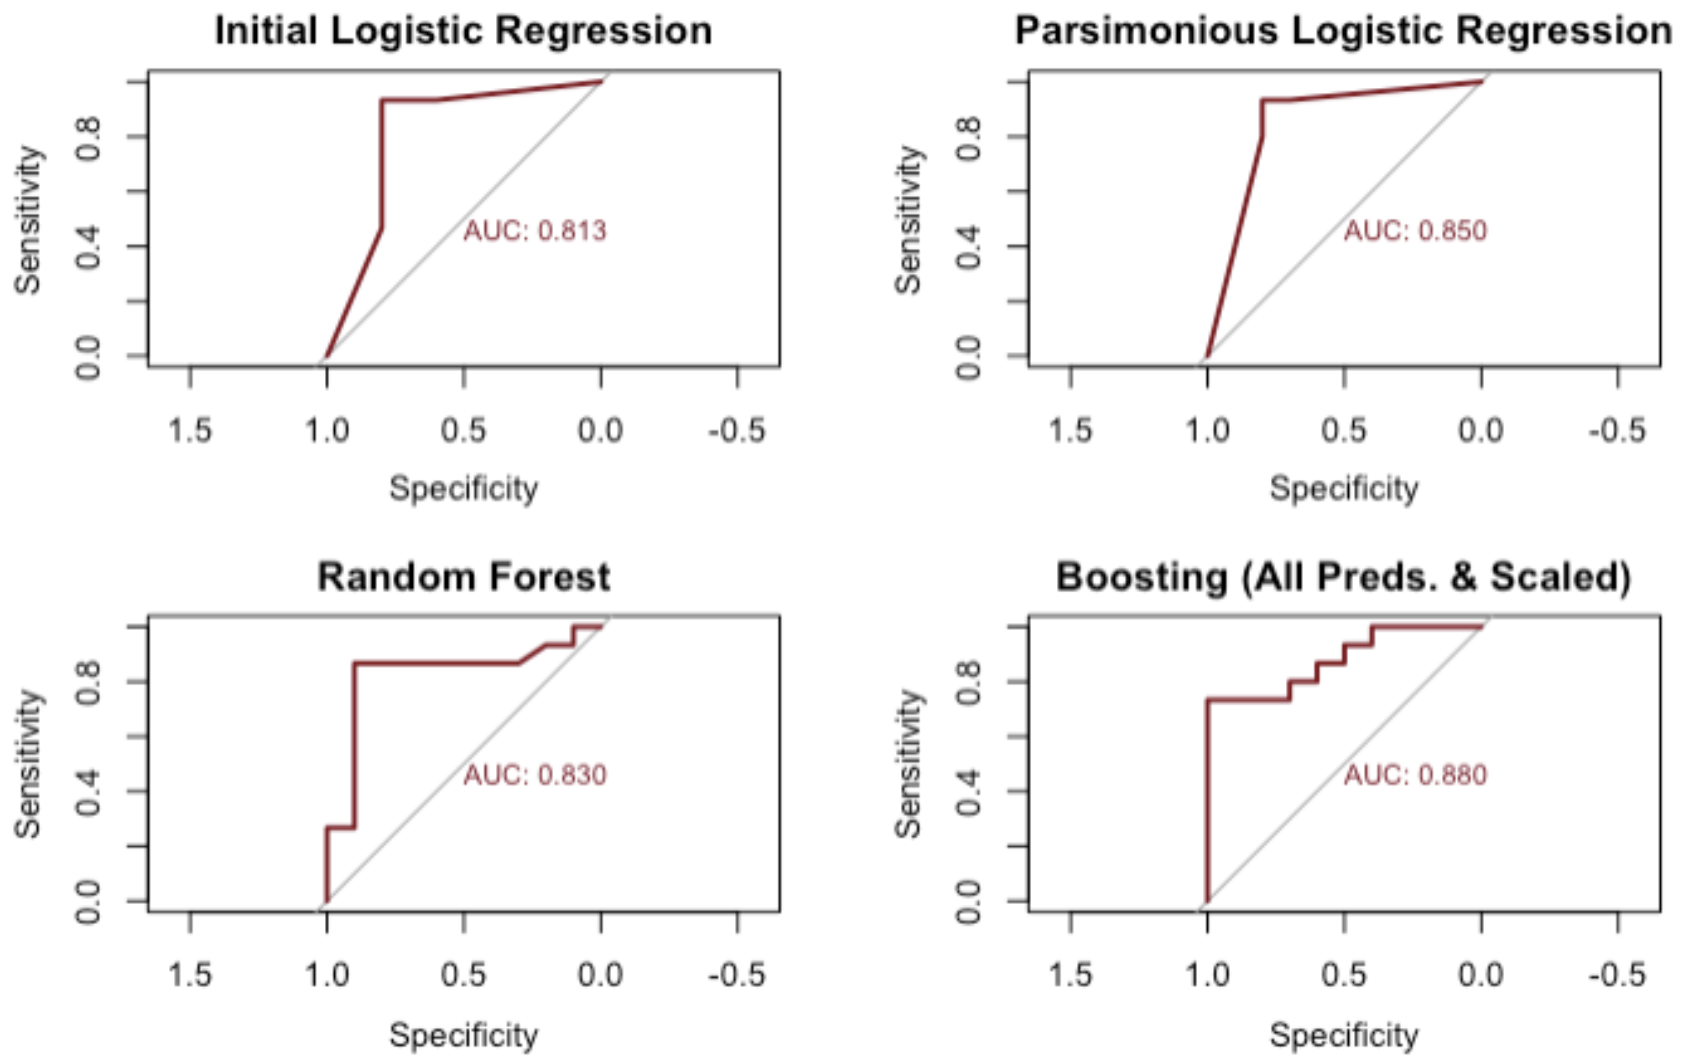
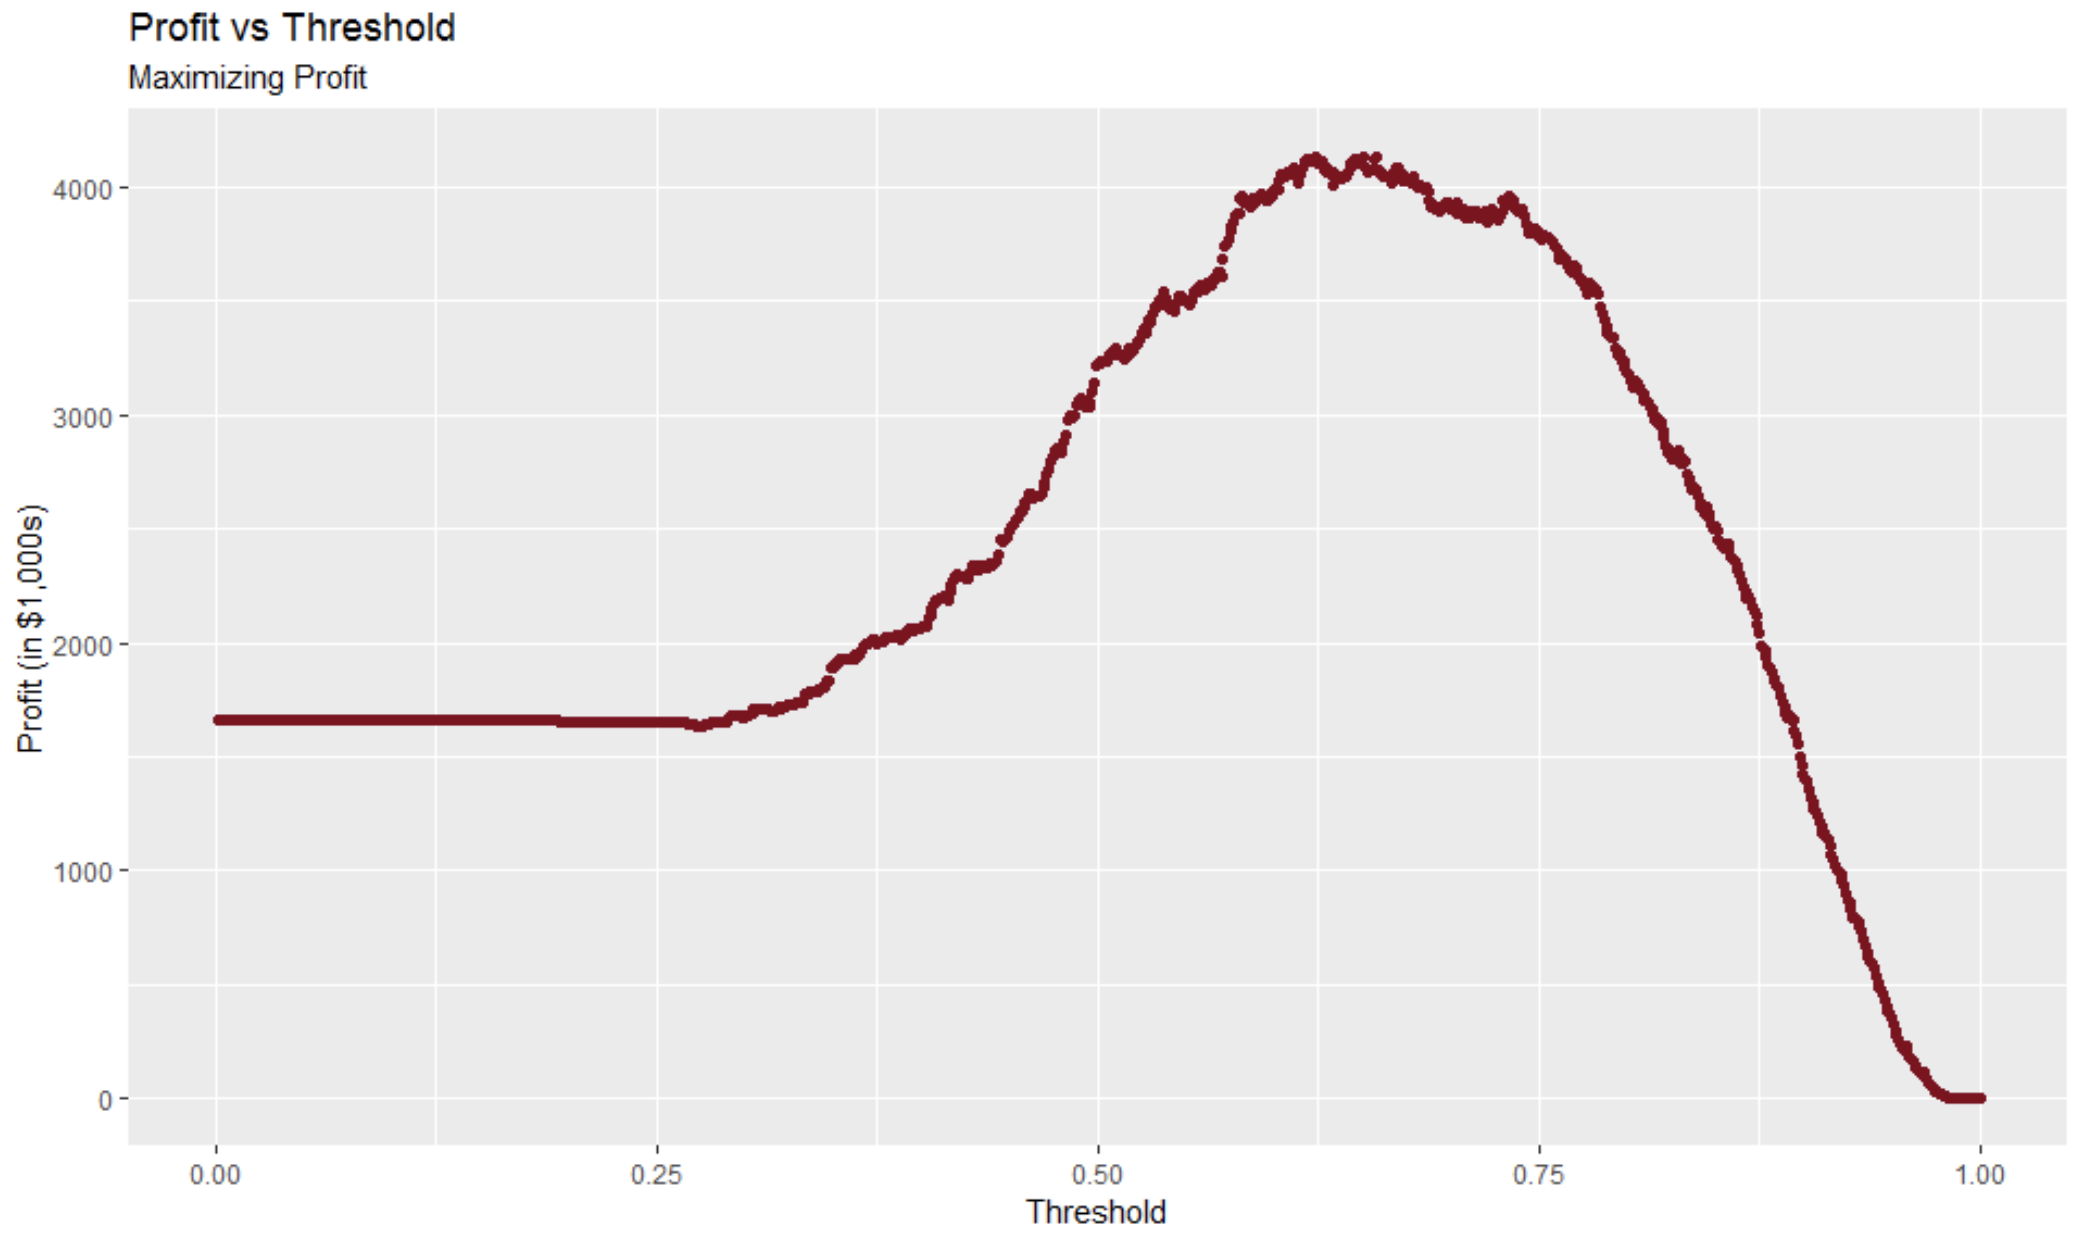
Final Project - Bank Loan Approval Optimization Report
I developed a report for a bank with recommendations on using logistic regression to maximize the accuracy of approved loans and maximize bank profit. Tasks included data cleanup, data exploration, feature engineering, imputing missing data, model development, model optimization for the dual goals, and authoring a summary report with recommendations.
Programming for Data Science
- Used Python and R to analyze real-world data.
- Used Git for professional version control.
- Used Python data structures to organize both numerical and text-based data.
- Performed exploratory data analysis in R.
- Tested statistical hypotheses using R functions.
- Used an application programming interface (API) to collect real-world data from social media.
- Cleaned and formatted data for analysis.
- Chose and implemented efficient methods for analyzing data sets.
- Followed best practices for documentation and readable code.
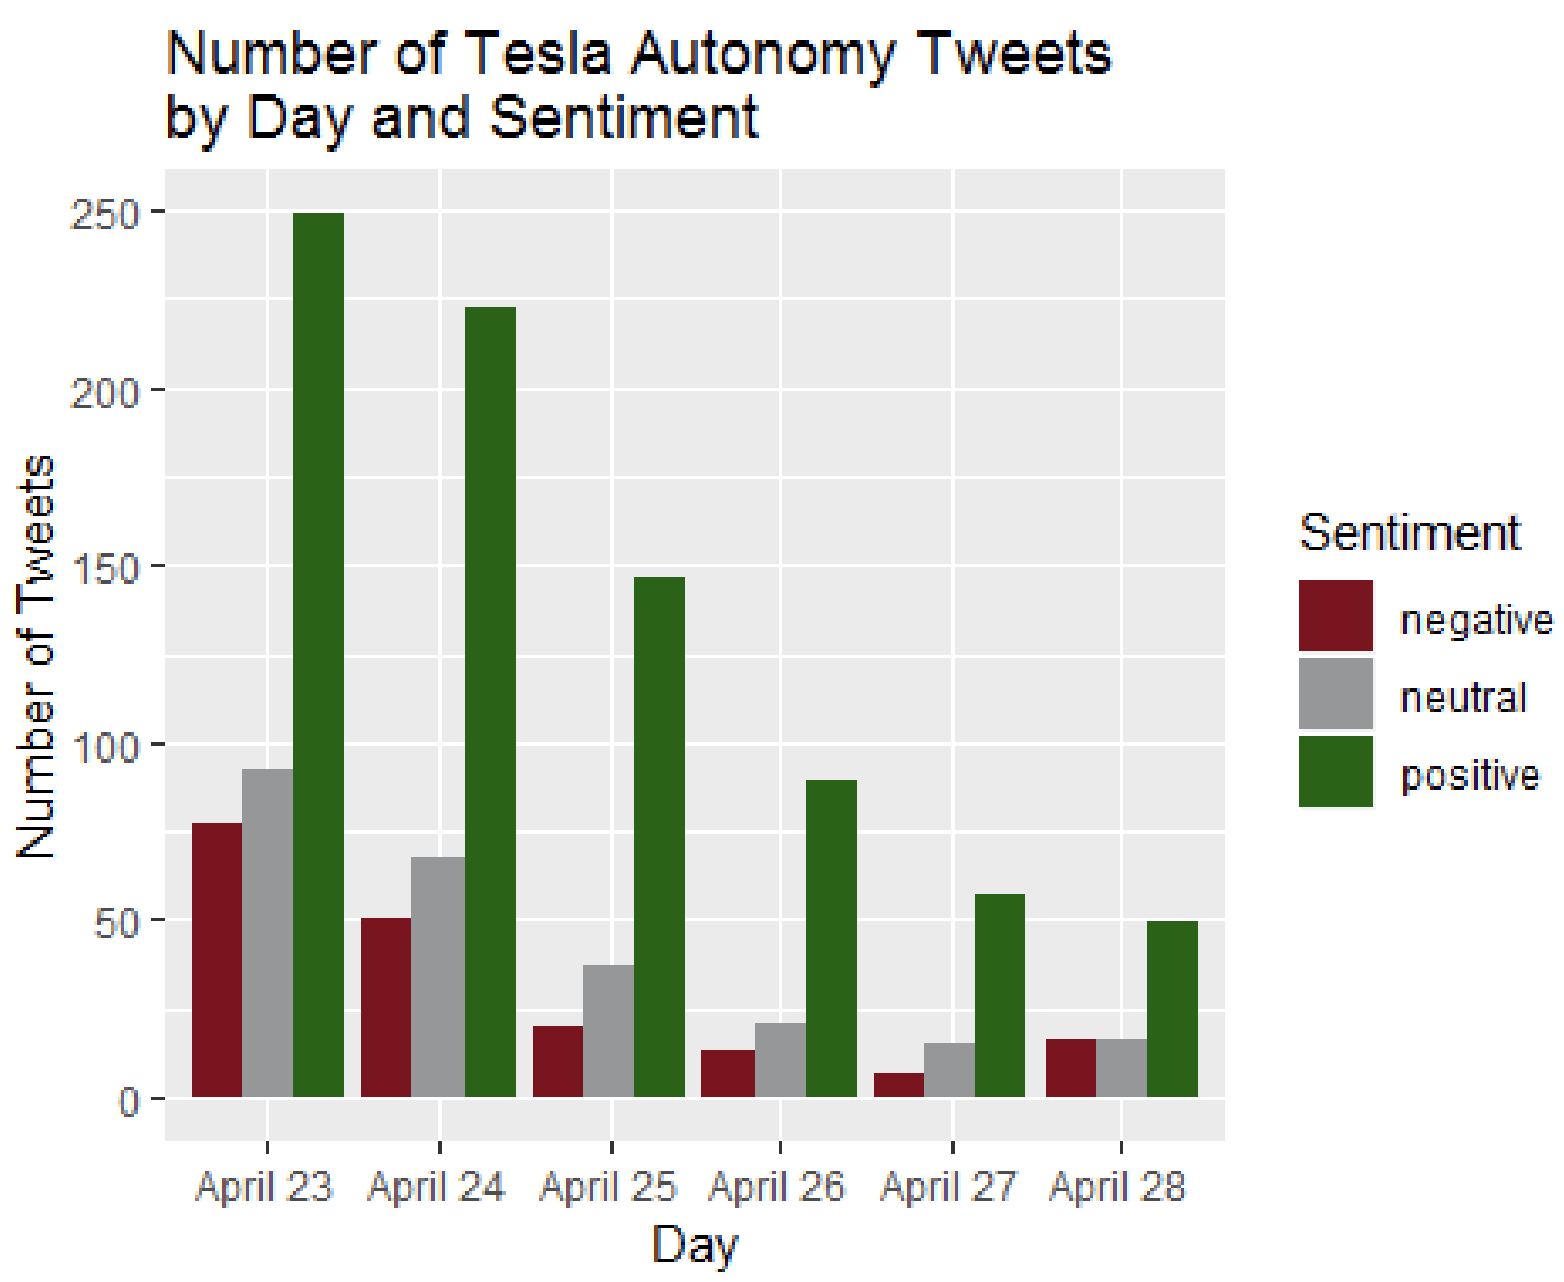
Final Project - Analysis of Tesla Autonomy Day Tweets Sentiment
The final project was an opportunity to apply what I had learned to answer a question that interested me by collecting and analyzing real-world data from Twitter. I chose to analyze the sentiment of tweets related to the “Tesla Autonomy Investor Day” event on April 22, 2019.
Deliverables included:
- Executive summary reporting my question, analysis, and results non-technically (pdf)
- Python notebook used to gather data from Twitter & process it for analysis in R (ipynb)
- Data from 100 tweets, along with any variables I computed about the tweets (csv)
- Parsed data for analysis in R (csv)
- R script containing the R code I used to analyze the data from Python (rmd)
Data Warehousing
- Collected, cleaned, and prepared data.
- Evaluated data in terms of source, volume, frequency, and flow.
- Identified and classified relevant variables for data science tasks.
- Chose and applied tools and methodologies to solve data science tasks.
- Assessed the model used to solve data science tasks.
- Interpreted data, extracted meaningful information, and assessed findings.
- Built OLAP cubes in SQL to slice and dice data from an MS SQL Server data warehouse.
Big Data High-Performance Computing
- Implemented algorithms that allowed for the distributed processing of large data sets across computing clusters.
- Created parallel algorithms that can process large data sets.
- Used tools and software such as Hadoop, Pig, Hive, and Python to compare large data-processing tasks using cloud-computing services.
Final Project - PGA Tour Stats with Hive
I used two datasets from the PGA Tour Golf Data by Brad Klassen on Kaggle to answer a number of queries using Hive on Hortonworks.
Communicating About Data
- Wrote, formatted, and presented technical prose.
- Helped non-technical professionals visualize, explore, and act on data science findings.
- Facilitated data-informed discussions through listening, questioning, and presenting.
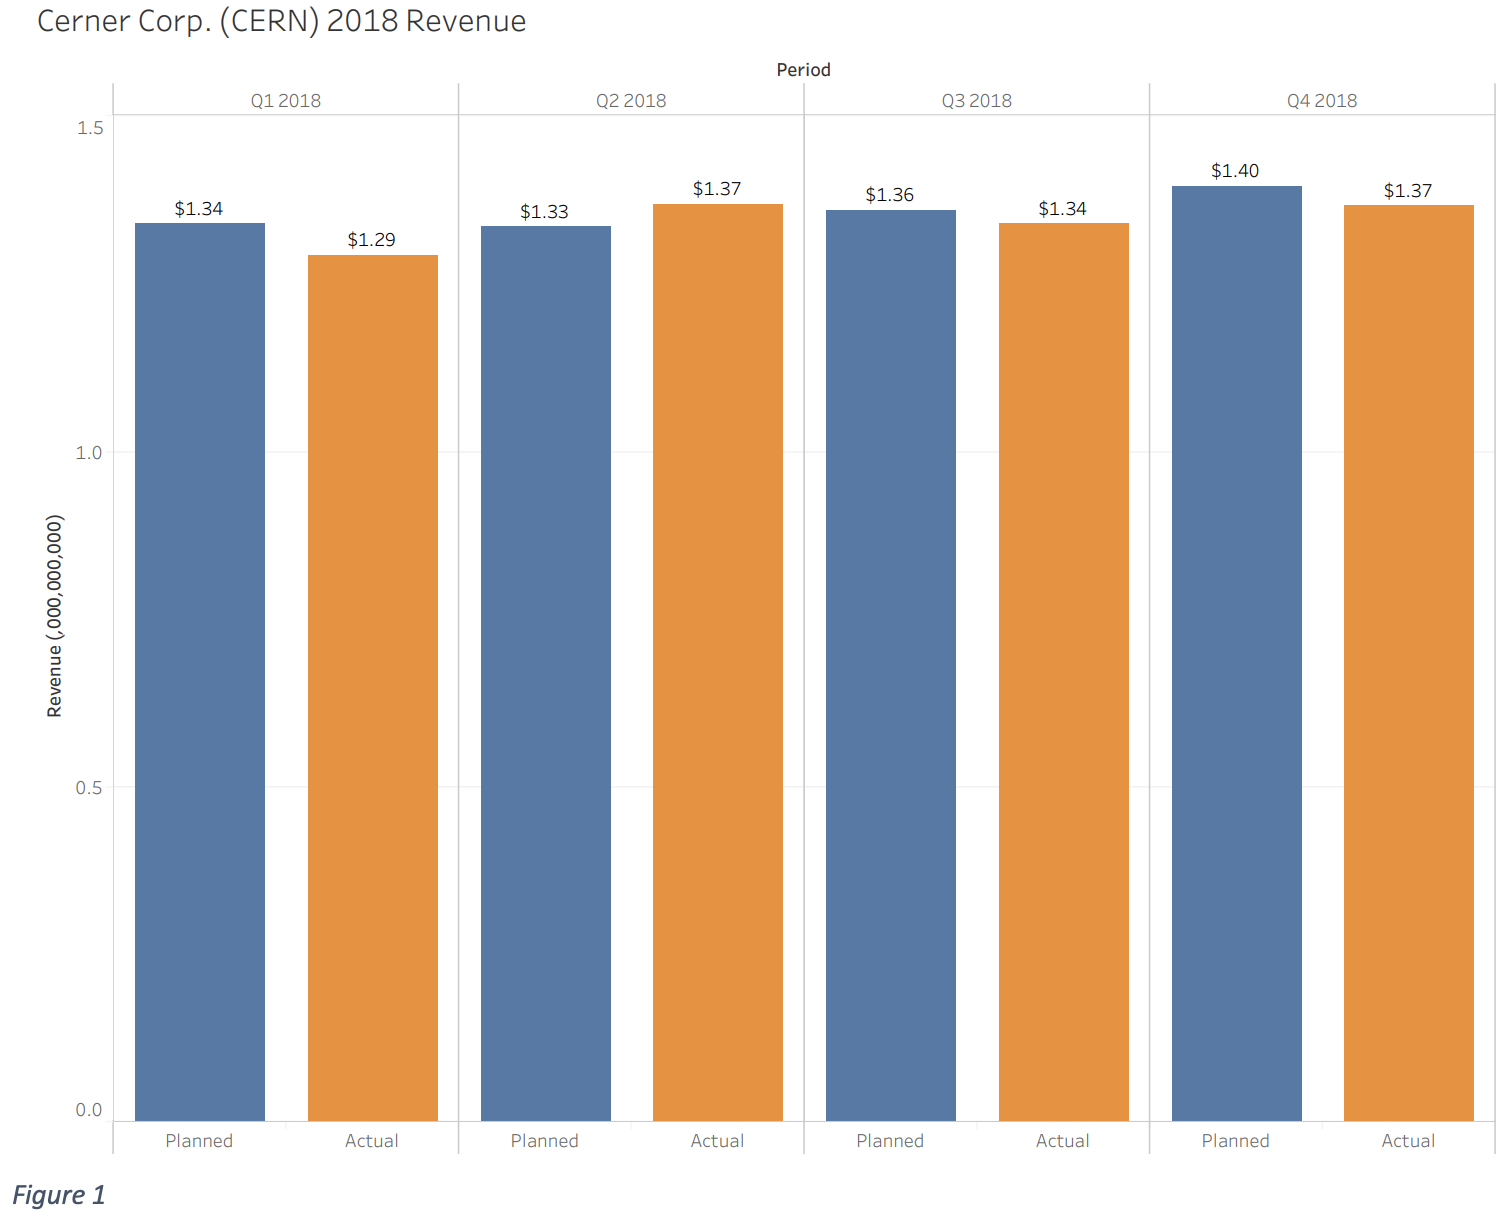
Project - Annual Report
For this project I created an executive summary of the Cerner 2018 annuual report that anyone could pick up, read, and understand using key information from the original annual report. I used Tableau for visualizations.
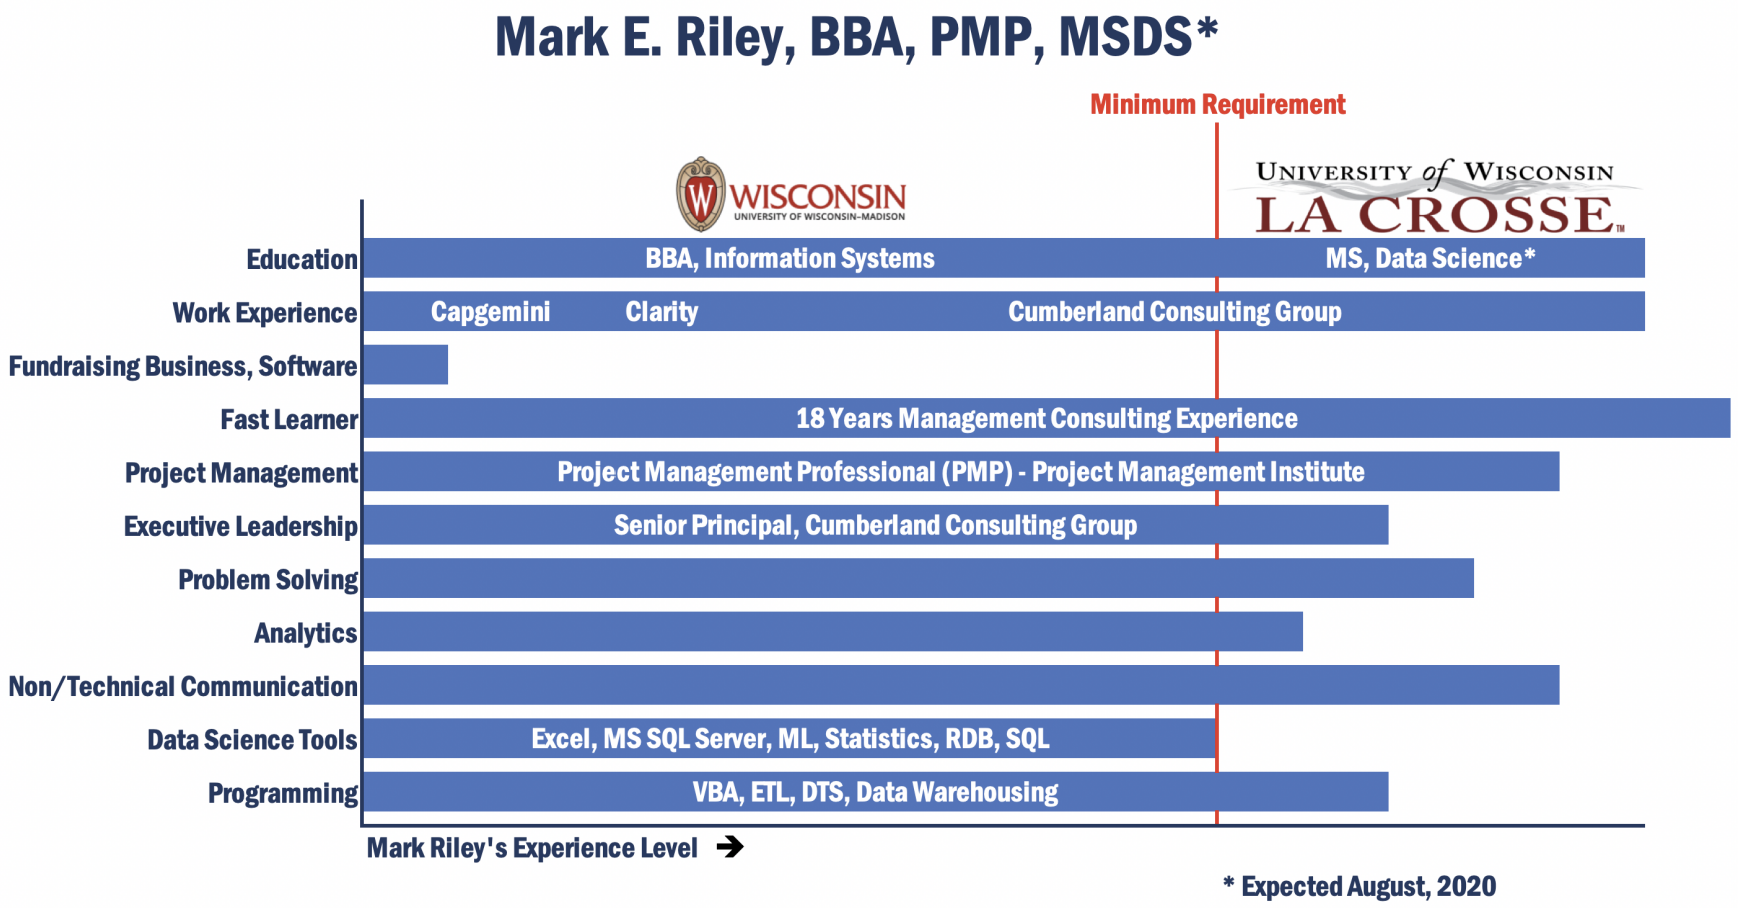
Project - Visual Résumés
I created two convincing and accessible visual résumés (graphics) that represented my skillset to two different job prospects/audiences. I created the graphics in Excel.
Data Mining & Machine Learning
- Implemented association rules, clustering algorithms, linear and logistic regression, regression and classification trees, neural networks, nearest neighbor.
- Used ensemble methods such as bagging and boosting.
- Assessed and deployed predictive models.
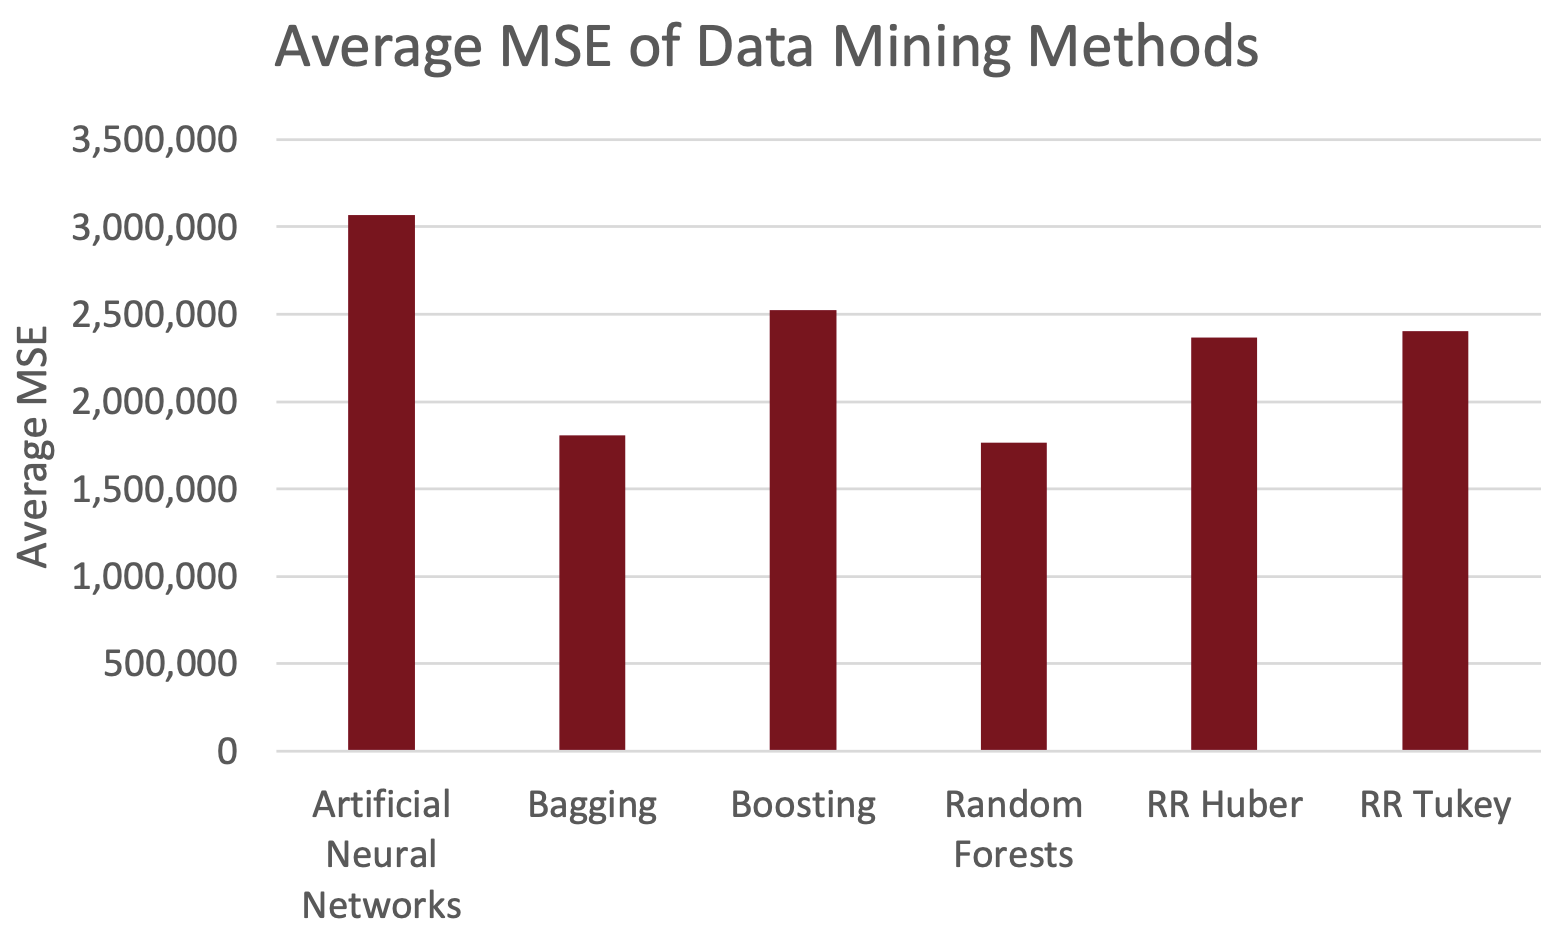
Final Project - Predicting Years of Potential Life Lost (YPLL)
Analysis to determine if I could accurately predict the Years of Potential Life Lost (YPLL) rate per 100,000 people in United States (US) Counties and the District of Columbia (DC) using the dataset US County Premature Mortality Rate by RoyXss on Kaggle. I used robust regression, bagging, boosting, random forests, and artificial neural networks in R.
Visualization & Unstructured Data Analysis
- Created effective visuals to maximize readability, comprehension, and understanding of complex datasets.
- Analyzed and critiqued examples of visualizations.
- Analyzed unstructured data using text mining and web text mining techniques.
- Performed social network analysis.
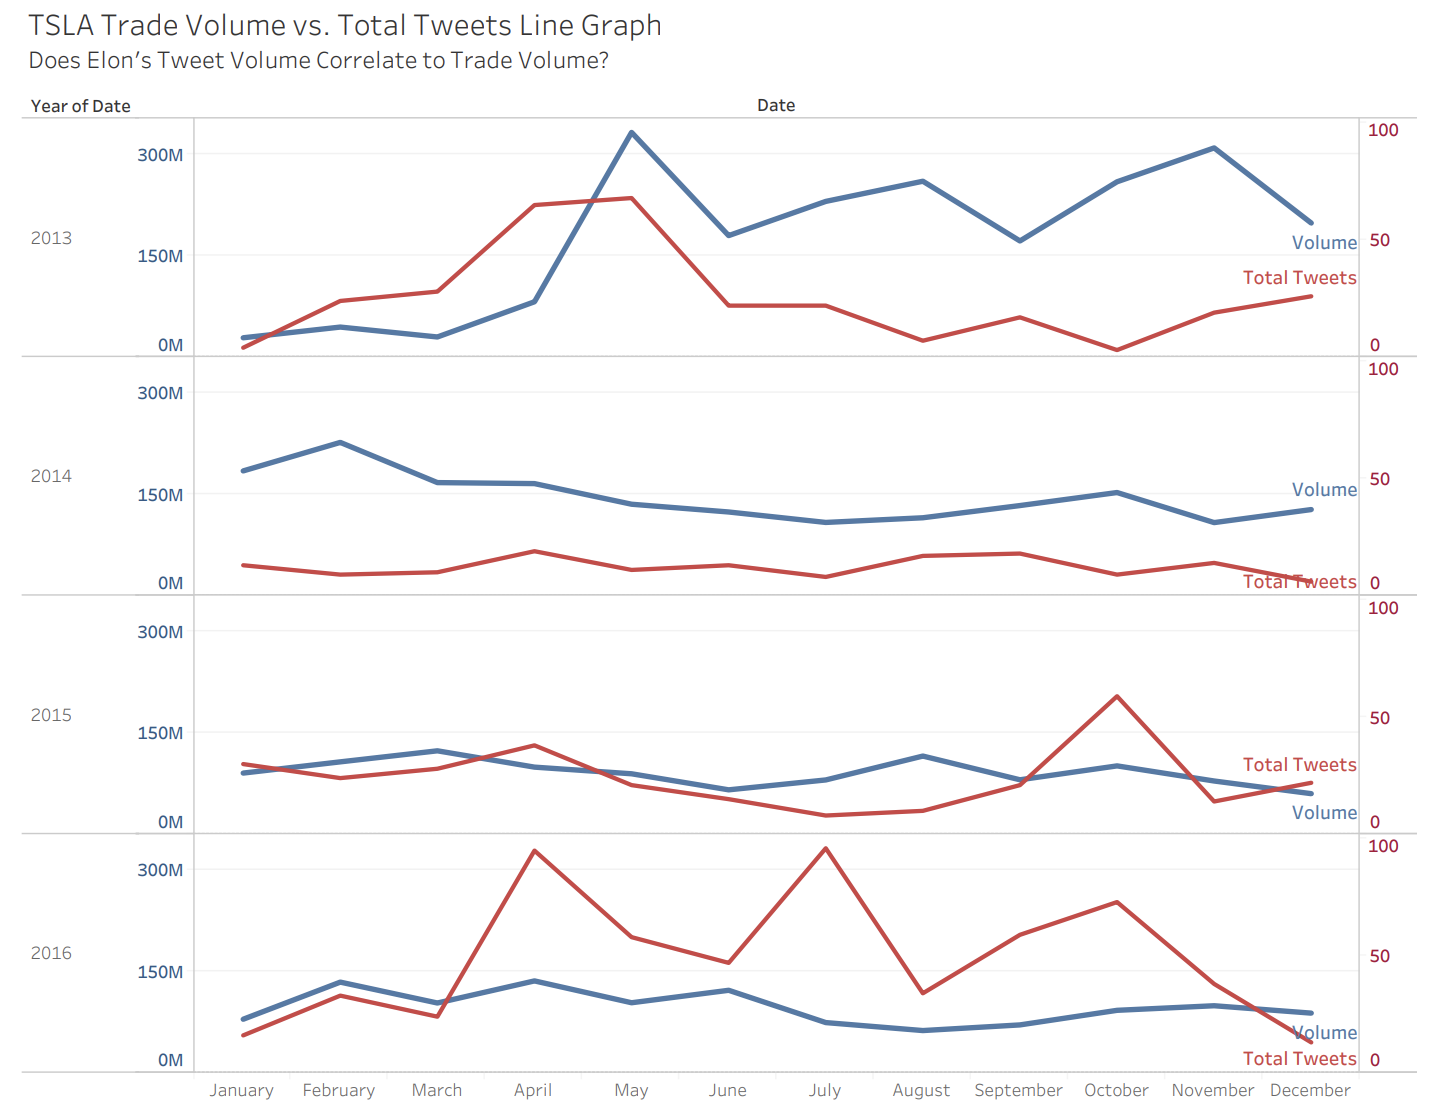
Visualization Project
I created visualizations in Tableau to determine if there was a relationship between tweets done by Elon Musk, CEO of Tesla, on the following day’s Tesla stock (TSLA) trade volume between 2013 and 2016. I used two datasets from Kaggle, Elon Musk’s Tweets by Kaan Ulgen and Tesla Stock Price by Rolando P. Aguirre.
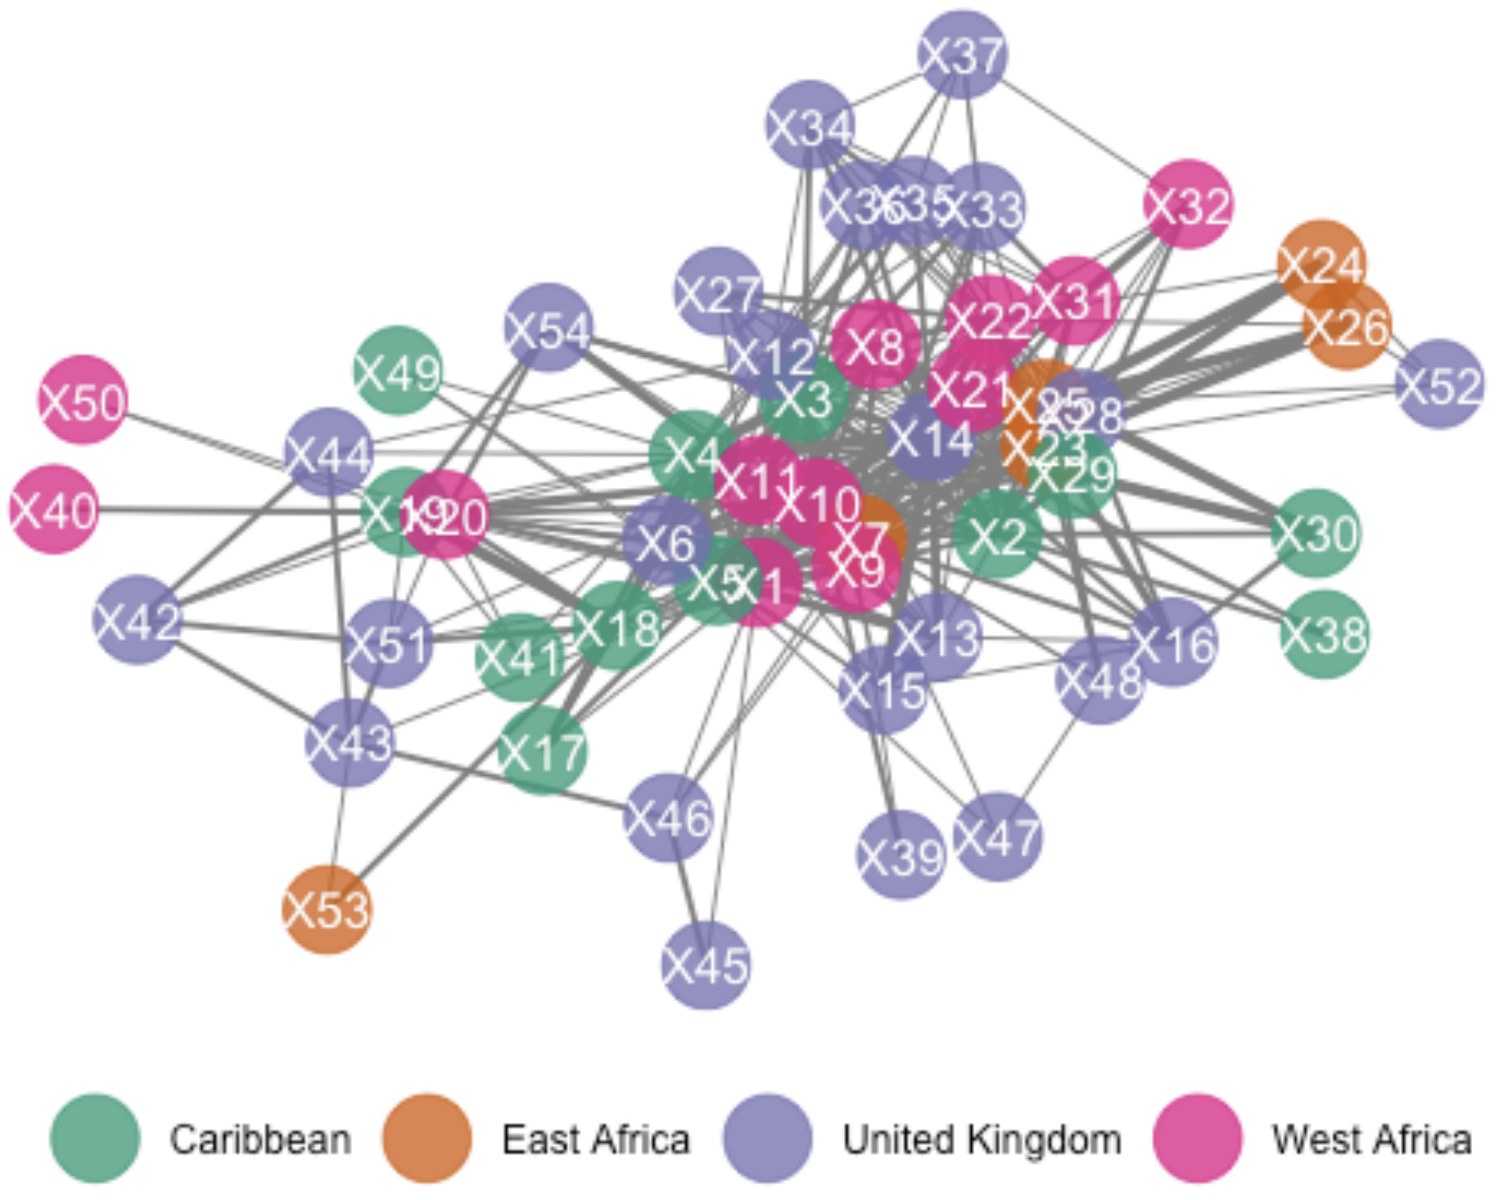
Network Analysis Project
I performed analysis of an undirected, weighted network representing relationships among 54 confirmed members of a London street gang, 2005-2009. Using R I analyzed gang member prominence from their degree, closeness, and betweenness metrics, created a network diagram, performed community detection, and created exponential random graph models (ERGM). The data source was London Gang on UCINET Software.
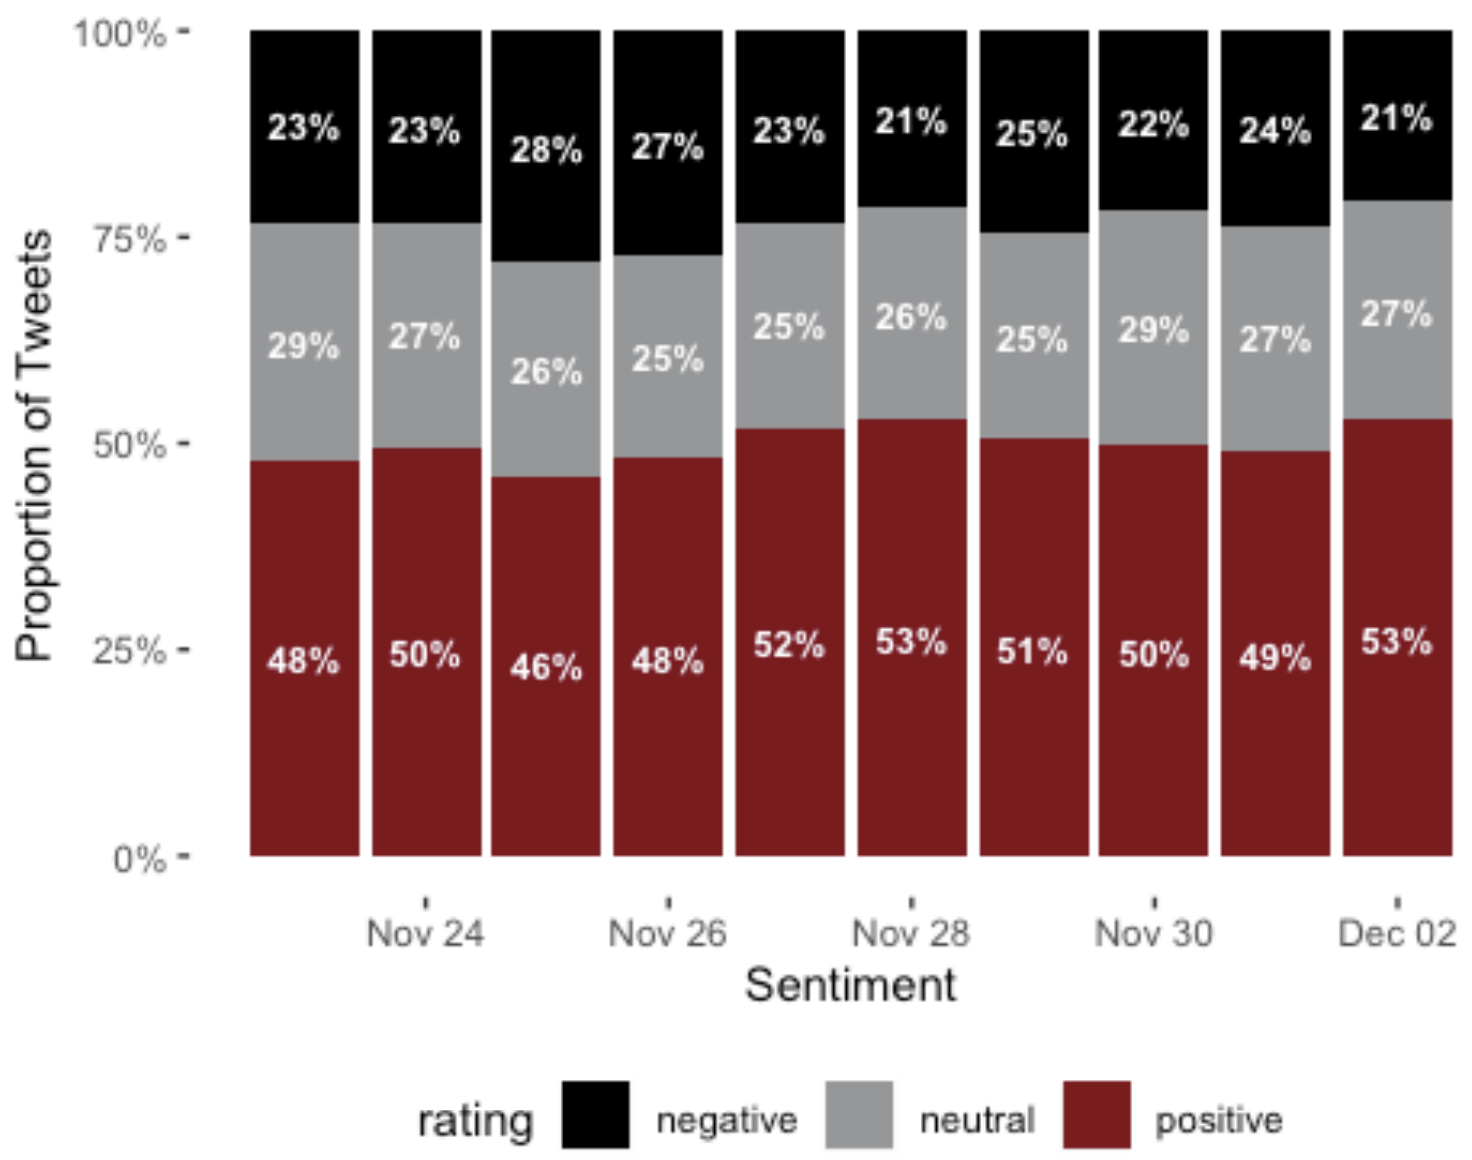
Text Mining/Natural Language Processing Project
I performed sentiment analysis of tweets regarding the Tesla Cybertruck launch event using R and the rtweet package.
Ethics of Data Science
- Identified and analyzed social, legal, and ethical issues in computer science and in the subfield of data science.
- Interpreted and applied a professional code of ethics relevant to the data science profession.
- Interpreted the activities and choices of others within an ethical framework and determined an appropriate action based on standards of professional conduct within computer science.
Final Project - Ethical Analysis of Project Nightingale
I performed an ethical analysis of Project Nightingale, a joint venture between Ascension and Google that began in November of 2019. I outlined two clear options/perspectives, each of which was supported by different ethical frameworks or moral theories, which considered a relevant code of professional ethics.
Prescriptive Analytics
- Used data and predictive analytics to inform the decision-making process.
- Selected and applied models appropriate for the nature of the data and the decision to be made.
- Assessed model feedback and make adjustments to produce desired outcomes.
- Methods studied included linear programming, sensitivity analysis, nonlinear programs, stochastic optimization, metaheuristics, simulated annealing, genetic algorithms, integer programming, constraint programming, simulation, decision analysis, collaborative filtering recommender systems, and content-based/hybrid recommender systems.
- Tools used included Python, CoCalc, Silver Decisions, linear regression, random forest regression, XGBoost classifier, GridSearchCV, RandomSearchCV, BayesianOptimization, and TPOT.
Data Science & Strategic Decision Making
- Transformed findings from data resources into actionable business strategies.
- Integrated data science capabilities into the formation of a situation analysis.
- Explained how data assets can be used to develop competitive advantage.
- Identified and appraised the leadership and management skills required to direct a team of data science professionals toward meeting organizational goals.
Project - Use of Data to Design and Operate Hotel Loyalty and Marketing Programs
I researched and wrote a deep-dive analysis on the use of data for marketing via hotel loyalty programs using trade and academic journals.
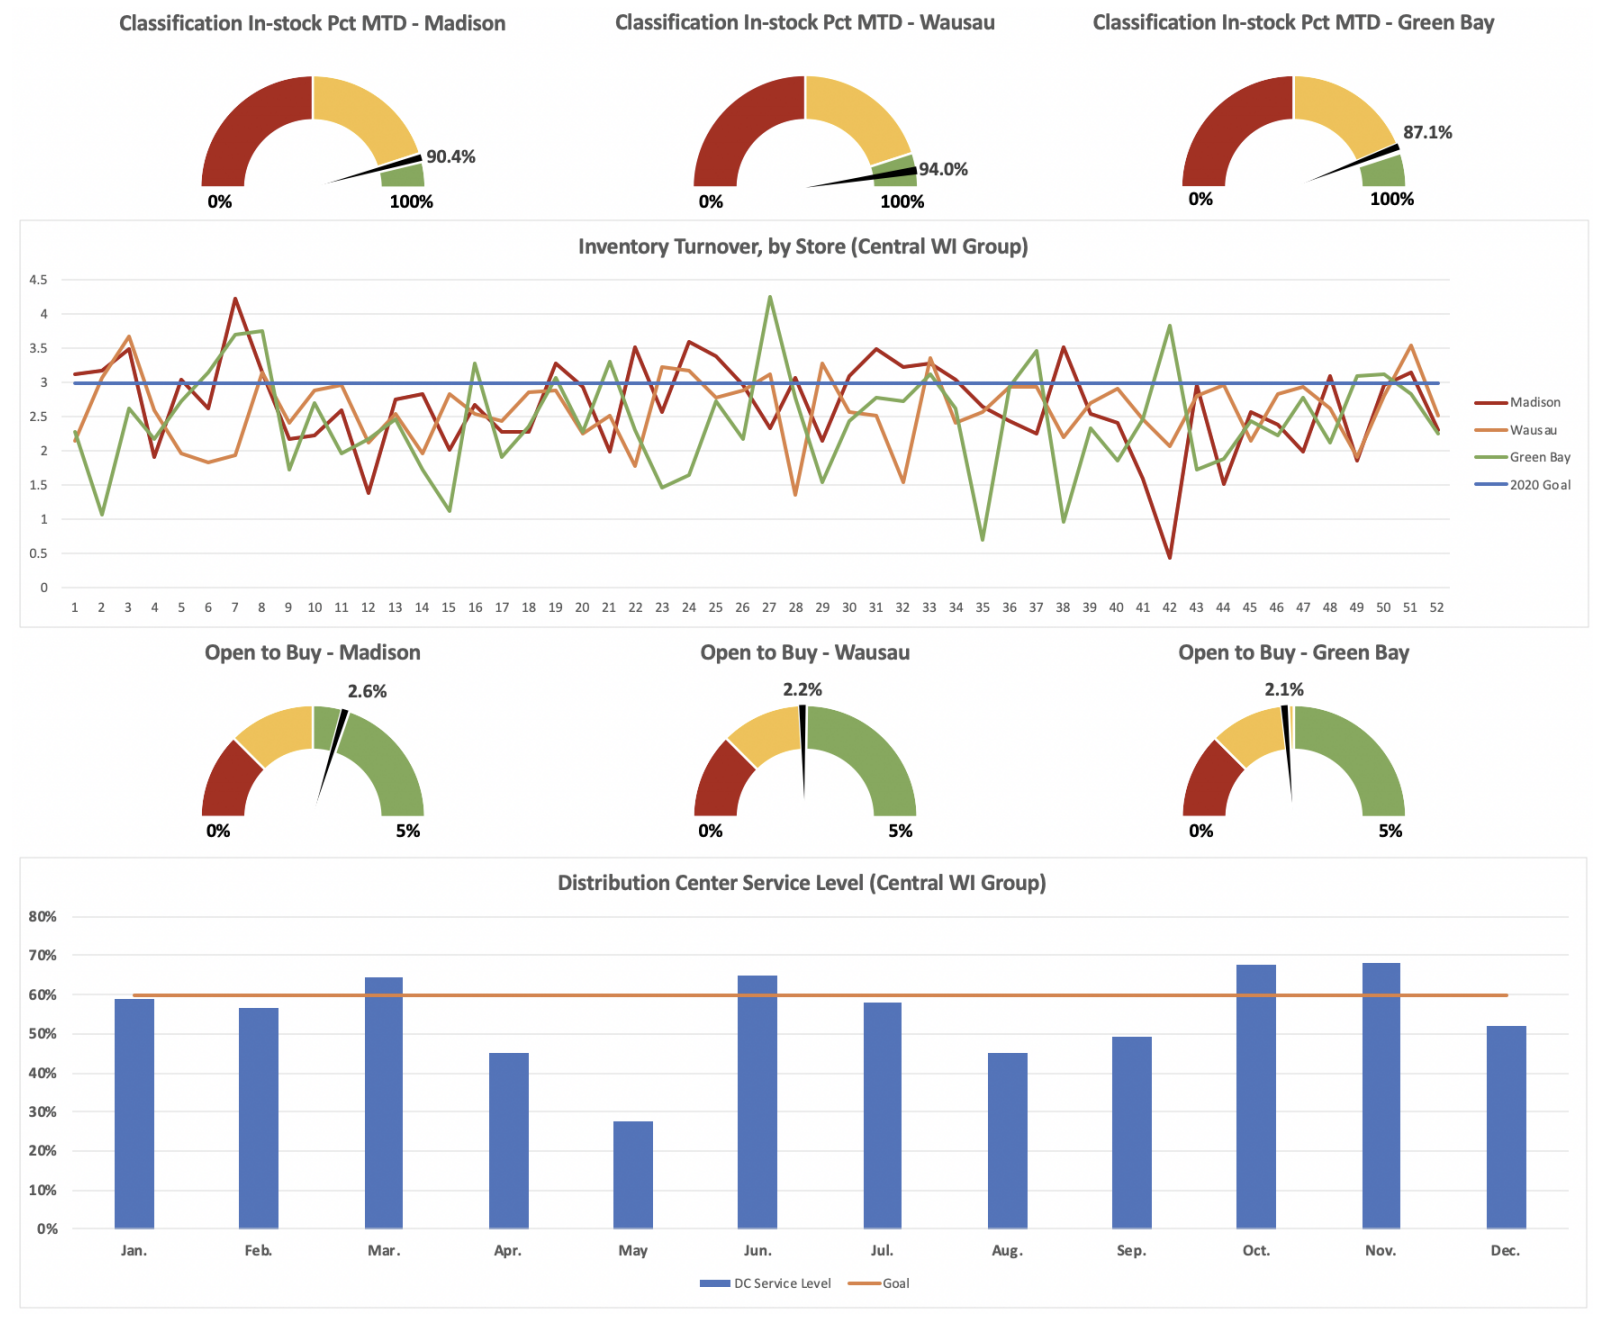
Project - Display of Information for Retail at Foot Locker, Inc.
I created mock-up operational data dashboards to share with decision makers in the roles of CEO, store manager, and replenishment analyst (merchandiser) at Foot Locker. My data sources included the Foot Locker 2019 Annual report and a collection of trade and academic journals. I created the dashboards in Excel.
Capstone
- Formulated a research question, problem or hypothesis that could be answered or tested using real-world data.
- Collected and managed data to devise solutions to my research question.
- Selected, applied and evaluated models, tools and methods to address my research question.
- Interpreted and assessed my results and evaluated the limitations of my findings.
- Prepared a professional report to effectively communicate my findings to a non-technical audience.
My capstone paper’s title was, “Applying Predictive Analytic Capabilities for CardioMEMS Patients.” This analysis aimed to determine if I could predict four adverse heart failure-related events by employing supervised classification algorithms with interpretable results using a combination of data from the CardioMEMS devices and patients’ electronic health records. The adverse health events in scope for this analysis were all-cause hospitalizations, heart failure-related hospitalizations, use of intravenous diuretic therapy outside of a hospitalization, and changes to pulmonary artery diastolic (PAD) pressure thresholds.